What you will learn:
Build reusable helper functions (
search_stac,stac_items_to_dataframe).Perform temporal and spatial exploratory analysis.
Compare hazard-code frequency across data sources with stacked bar charts.
Render an interactive Folium map colour-coded by hazard type and source.
Environment Setup
All dependencies are pre-installed. Click Launch Binder at the top of the page — no setup needed.
Run this in the first code cell before anything else:
!pip install -q pystac-client pandas matplotlib seaborn folium
import os; from getpass import getpass
if 'MONTANDON_API_TOKEN' not in os.environ:
    os.environ['MONTANDON_API_TOKEN'] = getpass('API token: ')
pip install -e . # from repo root
export MONTANDON_API_TOKEN='your_token_here'
jupyter labSee Getting Started for token instructions.
Step 1 — Imports and API Connection
# Import all necessary libraries

import pandas as pd
from pystac_client import Client
from datetime import datetime, timedelta
import matplotlib.pyplot as plt
import seaborn as sns
from typing import List, Dict, Any, Optional
import warnings
import os
from getpass import getpass

warnings.filterwarnings('ignore')

# Set display options for better readability
pd.set_option('display.max_rows', 20)
pd.set_option('display.max_columns', None)
pd.set_option('display.max_colwidth', 50)
pd.set_option('display.width', None)

# Plotting style
sns.set_style('whitegrid')
plt.rcParams['figure.figsize'] = (12, 6)

# Connect to Montandon STAC API with Authentication
STAC_API_URL = "https://montandon-eoapi-stage.ifrc.org/stac"

# Get authentication token
# Option 1: From environment variable (recommended for automation)
api_token = os.getenv('MONTANDON_API_TOKEN')

# Option 2: Prompt user for token if not in environment
if api_token is None:
    print("=" * 70)
    print("AUTHENTICATION REQUIRED")
    print("=" * 70)
    print("\nThe Montandon STAC API requires a Bearer Token for authentication.")
    print("\nHow to get your token:")
    print("  1. Visit: https://goadmin-stage.ifrc.org/")
    print("  2. Log in with your IFRC credentials")
    print("  3. Generate an API token from your account settings")
    print("\nAlternatively, set the MONTANDON_API_TOKEN environment variable:")
    print("  PowerShell: $env:MONTANDON_API_TOKEN = 'your_token_here'")
    print("  Bash: export MONTANDON_API_TOKEN='your_token_here'")
    print("\n" + "=" * 70)

    # Prompt for token (hidden input)
    api_token = getpass("Enter your Montandon API Token: ")

    if not api_token or api_token.strip() == "":
        raise ValueError("API token is required to access the Montandon STAC API")

# Create authentication headers
auth_headers = {"Authorization": f"Bearer {api_token}"}

# Connect to STAC API with authentication
try:
    client = Client.open(STAC_API_URL, headers=auth_headers)
    print(f"\n✓ Connected to: {STAC_API_URL}")
    print(f"✓ Authentication: Bearer Token (OpenID Connect)")
except Exception as e:
    print(f"\n✗ Authentication failed: {e}")
    print("\nPlease check:")
    print("  1. Your token is valid and not expired")
    print("  2. You have the correct permissions")
    print("  3. The API endpoint is accessible")
    raise
======================================================================
AUTHENTICATION REQUIRED
======================================================================
The Montandon STAC API requires a Bearer Token for authentication.
How to get your token:
1. Visit: https://goadmin-stage.ifrc.org/
2. Log in with your IFRC credentials
3. Generate an API token from your account settings
Alternatively, set the MONTANDON_API_TOKEN environment variable:
PowerShell: $env:MONTANDON_API_TOKEN = 'your_token_here'
Bash: export MONTANDON_API_TOKEN='your_token_here'
======================================================================
✓ Connected to: https://montandon-eoapi-stage.ifrc.org/stac
✓ Authentication: Bearer Token (OpenID Connect)
# Define helper function for searching STAC data using client.search()
# This uses the standard pystac_client search interface

def search_stac(
    collections: Optional[List[str]] = None,
    max_items: int = 100,
    bbox: Optional[List[float]] = None,
    datetime_range: Optional[str] = None,
    query: Optional[Dict[str, Any]] = None,
    sortby: Optional[List[str]] = None,
    filter_body: Optional[Dict[str, Any]] = None,
    filter_lang: Optional[str] = None,
) -> list:
    """
    Search STAC API using pystac_client's client.search() method.

    This uses the standard pystac_client search interface which handles
    pagination automatically.

    Parameters:
    -----------
    collections : list of str
        Collection IDs to search
    max_items : int
        Maximum number of results to return
    bbox : list of float
        Bounding box [min_lon, min_lat, max_lon, max_lat]
    datetime_range : str
        ISO 8601 datetime range "start/end"
    query : dict
        Query filters
    sortby : list
        Sort fields
    filter_body : dict
        CQL2 filter body
    filter_lang : str
        Filter language (cql2-json)

    Returns:
    --------
    list of pystac Item objects
        Items with .id, .collection_id, .properties (dict), .geometry, .bbox
    """
    # Build search parameters
    search_params = {"max_items": max_items}

    if collections:
        search_params["collections"] = collections
    if bbox:
        search_params["bbox"] = bbox
    if datetime_range:
        search_params["datetime"] = datetime_range
    if query:
        search_params["query"] = query
    if sortby:
        search_params["sortby"] = sortby
    if filter_body:
        search_params["filter"] = filter_body
    if filter_lang:
        search_params["filter_lang"] = filter_lang

    # Use client.search() - pagination is handled automatically
    search = client.search(**search_params)

    # Return list of items
    return list(search.items())


print("✅ PySTAC helper function initialized (using client.search())")
✅ PySTAC helper function initialized (using client.search())
Step 2 — Reusable Helper Functions
Two functions power this recipe:
| Function | Purpose |
|---|---|
search_stac() | Wraps client.search() with optional CQL2, bbox, and datetime parameters |
stac_items_to_dataframe() | Flattens STAC items into a tidy DataFrame |
def stac_items_to_dataframe(items: list) -> pd.DataFrame:
    """
    Convert a list of STAC items to a pandas DataFrame.

    Parameters:
    -----------
    items : list
        List of STAC items

    Returns:
    --------
    pd.DataFrame
        DataFrame with flattened properties
    """
    data = []

    for item in items:
        # Base information
        row = {
            'id': item.id,
            'collection_id': item.collection_id,
            'geometry_type': item.geometry['type'] if item.geometry else None,
        }

        # Extract coordinates
        if item.geometry and item.geometry.get('coordinates'):
            coords = item.geometry['coordinates']
            if item.geometry['type'] == 'Point':
                row['longitude'] = coords[0]
                row['latitude'] = coords[1]

        # Add all properties
        for key, value in item.properties.items():
            # Handle nested dictionaries
            if isinstance(value, dict):
                for sub_key, sub_value in value.items():
                    row[f"{key}.{sub_key}"] = sub_value
            else:
                row[key] = value

        data.append(row)

    return pd.DataFrame(data)

print("DataFrame conversion function created")
DataFrame conversion function created
Step 3 — Convert STAC Items to a DataFrame
The stac_items_to_dataframe() function:
Extracts base fields (
id,collection_id,geometry_type).Parses geographic coordinates from
Pointgeometries.Flattens nested properties (e.g.,
monty:hazard_detail.severity_value).
# Get some data to convert
items = search_stac(
    collections=['gdacs-events'],
    max_items=50
)

# Convert to DataFrame
df = stac_items_to_dataframe(items)

print(f"DataFrame created with {len(df)} rows and {len(df.columns)} columns\n")
print("Column names:")
print(df.columns.tolist())

# Display first few rows
df.head()
DataFrame created with 50 rows and 20 columns
Column names:
['id', 'collection_id', 'geometry_type', 'longitude', 'latitude', 'roles', 'title', 'datetime', 'keywords', 'description', 'end_datetime', 'monty:etl_id', 'severitydata.severity', 'severitydata.severitytext', 'severitydata.severityunit', 'monty:corr_id', 'start_datetime', 'monty:hazard_codes', 'monty:country_codes', 'monty:episode_number']
Step 4 — Exploratory Data Analysis
# Data summary
print("Basic Dataset Statistics:\n")
print(df.describe())
Basic Dataset Statistics:
longitude latitude severitydata.severity monty:episode_number
count 50.000000 50.000000 50.000000 5.000000e+01
mean 47.191573 15.212496 262.368000 8.046509e+05
std 125.001690 32.647875 1304.252939 8.460090e+05
min -177.559200 -58.808900 4.500000 1.000000e+00
25% -68.671400 -15.793174 4.700000 1.000000e+00
50% 124.048850 18.309500 5.000000 1.000000e+00
75% 142.850200 41.042325 5.275000 1.676376e+06
max 179.972700 62.195700 7834.000000 1.676468e+06
4. Hazard Code Descriptions
Define mappings for hazard codes used across different disaster data standards (GDACS, EM-DAT, UNDRR-ISC).
# Hazard code mapping with descriptions (used in multi-collection analysis below)
hazard_descriptions = {
    'FL': 'Flooding',
    'EQ': 'Earthquake',
    'TC': 'Cyclone/Depression',
    'TS': 'Tsunami',
    'VO': 'Volcanic Eruption',
    'DR': 'Drought',
    'nat-hyd-flo-flo': 'Flooding (EM-DAT)',
    'nat-geo-ear-gro': 'Earthquake (EM-DAT)',
    'nat-met-sto-tro': 'Cyclone/Storm (EM-DAT)',
    'nat-geo-ear-tsu': 'Tsunami (EM-DAT)',
    'nat-geo-vol-vol': 'Volcanic Eruption (EM-DAT)',
    'nat-cli-dro-dro': 'Drought (EM-DAT)',
    'MH0600': 'Flooding (UNDRR-ISC)',
    'MH0306': 'Cyclone/Wind (UNDRR-ISC)',
    'MH0705': 'Tsunami/Marine (UNDRR-ISC)',
    'GH0201': 'Volcanic Eruption (UNDRR-ISC)',
    'MH0401': 'Drought (UNDRR-ISC)',
    'GH0101': 'Earthquake (UNDRR-ISC)',
}

print("Hazard code descriptions loaded")
Hazard code descriptions loaded
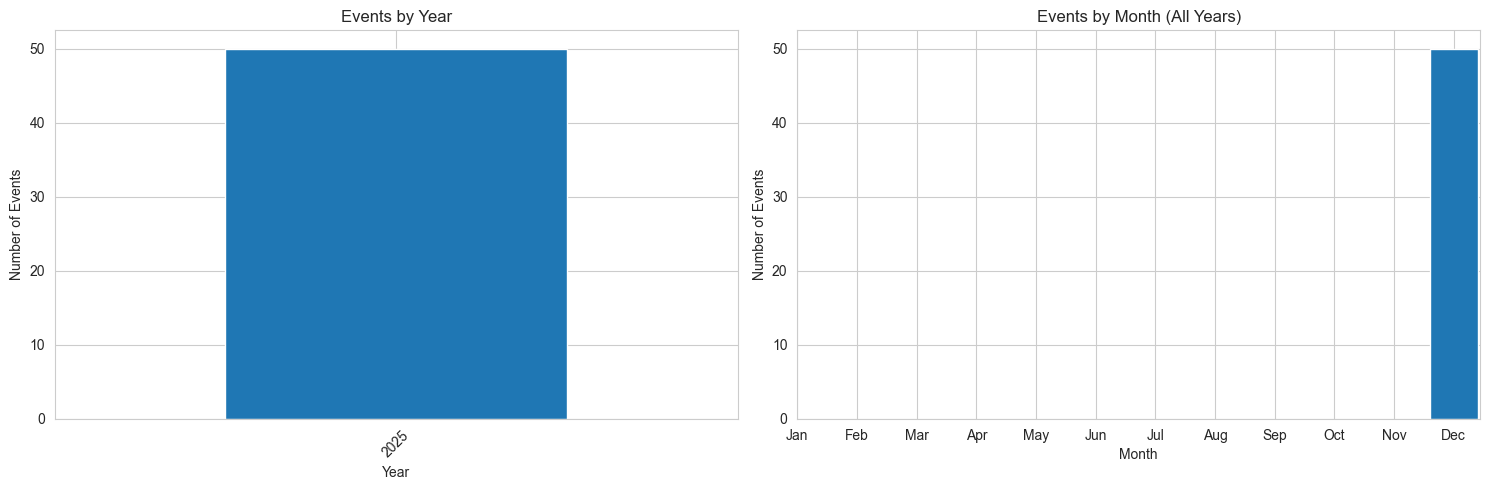
4.1 Temporal Analysis
Analyzing when disasters occur by year and month to identify patterns and trends.
# Convert datetime to pandas datetime
if 'datetime' in df.columns:
    df['datetime_parsed'] = pd.to_datetime(df['datetime'], errors='coerce')
    df['year'] = df['datetime_parsed'].dt.year
    df['month'] = df['datetime_parsed'].dt.month
    df['year_month'] = df['datetime_parsed'].dt.to_period('M')

    # Events by year
    yearly_counts = df['year'].value_counts().sort_index()

    print("Events by Year:\n")
    print(yearly_counts)

    # Visualize
    if len(yearly_counts) > 0:
        fig, (ax1, ax2) = plt.subplots(1, 2, figsize=(15, 5))

        # Yearly trend
        yearly_counts.plot(kind='bar', ax=ax1)
        ax1.set_xlabel('Year')
        ax1.set_ylabel('Number of Events')
        ax1.set_title('Events by Year')
        ax1.tick_params(axis='x', rotation=45)

        # Monthly distribution
        monthly_counts = df['month'].value_counts().sort_index()
        month_names = ['Jan', 'Feb', 'Mar', 'Apr', 'May', 'Jun',
                      'Jul', 'Aug', 'Sep', 'Oct', 'Nov', 'Dec']
        ax2.bar(monthly_counts.index, monthly_counts.values)
        ax2.set_xticks(range(1, 13))
        ax2.set_xticklabels(month_names)
        ax2.set_xlabel('Month')
        ax2.set_ylabel('Number of Events')
        ax2.set_title('Events by Month (All Years)')

        plt.tight_layout()
        plt.show()
else:
    print("Datetime column not found in this dataset")
Events by Year:
year
2025 50
Name: count, dtype: int64
5. Data Export
Export the full dataset to CSV format for use in spreadsheet applications or other analysis tools.
5.1 CSV Export
# Select specific columns for export
columns_to_export = ['id', 'collection_id', 'datetime', 'monty:country_codes',
                     'monty:hazard_codes', 'monty:corr_id']

# Filter columns that exist
existing_columns = [col for col in columns_to_export if col in df.columns]

if existing_columns:
    df_subset = df[existing_columns]
    subset_filename = 'gdacs_events_subset.csv'
    df_subset.to_csv(subset_filename, index=False)

    print(f"Subset exported to {subset_filename}")
    print(f"   Columns: {existing_columns}")
    print(f"\nSample data:")
    print(df_subset.head())
else:
    print("None of the specified columns exist in the dataset")
Subset exported to gdacs_events_subset.csv
Columns: ['id', 'collection_id', 'datetime', 'monty:country_codes', 'monty:hazard_codes', 'monty:corr_id']
Sample data:
id collection_id datetime \
0 gdacs-event-1514353 gdacs-events 2025-12-10T08:27:06Z
1 gdacs-event-1514350 gdacs-events 2025-12-10T07:42:55Z
2 gdacs-event-1514341 gdacs-events 2025-12-10T06:38:27Z
3 gdacs-event-1514332 gdacs-events 2025-12-10T05:18:49Z
4 gdacs-event-1514294 gdacs-events 2025-12-09T23:19:52Z
monty:country_codes monty:hazard_codes \
0 [COL] [GH0101, EQ, nat-geo-ear-gro]
1 [IDN] [GH0101, EQ, nat-geo-ear-gro]
2 [CHL] [GH0101, EQ, nat-geo-ear-gro]
3 [] [GH0101, EQ, nat-geo-ear-gro]
4 [RUS] [GH0101, EQ, nat-geo-ear-gro]
monty:corr_id
0 20251210-COL-GH0101-1676468-GCDB
1 20251210-IDN-GH0101-1676464-GCDB
2 20251210-CHL-GH0101-1676453-GCDB
3 20251210--GH0101-1676442-GCDB
4 20251209-RUS-GH0101-1676432-GCDB
6. Multi-Collection Hazard Code Analysis
This section analyzes the top 10 most common hazard codes across multiple data sources (GDACS, EM-DAT, GLIDE) to:
Count how many times each hazard code appears
Compare hazard code distribution across different collections
Identify which disaster types are most common
Visualize the results with detailed charts
This helps us understand:
Which disaster types are most frequently recorded
How different data sources classify the same disasters
The overall distribution of hazard events in the database
# Count hazard codes across all collections
print("Hazard Code Analysis\n")
print("Analyzing hazard codes from multiple data sources...\n")

# Search across multiple collections
disaster_collections = ['gdacs-events', 'glide-events']

print(f"Collections to analyze: {', '.join(disaster_collections)}\n")

# Track hazard codes
hazard_counts = {}  # Track all hazard codes
hazard_by_collection = {}  # Track by collection

for collection in disaster_collections:
    hazard_by_collection[collection] = {}
    try:
        items = search_stac(collections=[collection], max_items=100)

        # Count hazard codes from all items
        for item in items:
            hazard_codes = item.properties.get('monty:hazard_codes', [])

            if isinstance(hazard_codes, list):
                for hazard in hazard_codes:
                    # Count globally
                    hazard_counts[hazard] = hazard_counts.get(hazard, 0) + 1
                    # Count by collection
                    hazard_by_collection[collection][hazard] = hazard_by_collection[collection].get(hazard, 0) + 1

        print(f"  {collection}: {len(items)} items retrieved")
    except Exception as e:
        print(f"  {collection}: Error - {str(e)}")

# Create DataFrame of hazard counts
if hazard_counts:
    print("\n" + "="*80)
    print("HAZARD CODE COUNTS")
    print("="*80)

    hazard_data = []
    for hazard_code in sorted(hazard_counts.keys(), key=lambda x: hazard_counts[x], reverse=True):
        total_count = hazard_counts[hazard_code]
        description = hazard_descriptions.get(hazard_code, "Unknown")

        # Get counts by collection
        collection_counts = {}
        for collection in disaster_collections:
            collection_counts[collection] = hazard_by_collection.get(collection, {}).get(hazard_code, 0)

        hazard_data.append({
            'Hazard Code': hazard_code,
            'Description': description,
            'Total Count': total_count,
            'GDACS': collection_counts.get('gdacs-events', 0),
            'EM-DAT': collection_counts.get('emdat-events', 0),
            'GLIDE': collection_counts.get('glide-events', 0),
        })

    hazard_df = pd.DataFrame(hazard_data)

    # Limit to top 10 hazard codes
    hazard_df_top10 = hazard_df.head(10)

    print("\nTop 10 Hazard Code Counts:\n")
    print(hazard_df_top10.to_string(index=False))

    # Create visualization
    fig, ax = plt.subplots(figsize=(14, 7))

    # Create labels combining code and description (top 10 only)
    labels = [f"{row['Hazard Code']}\n{row['Description']}" for _, row in hazard_df_top10.iterrows()]

    # Stacked bar chart by collection
    collections = ['GDACS', 'EM-DAT', 'GLIDE']
    colors = ['#1f77b4', '#ff7f0e', '#2ca02c']
    x_pos = range(len(hazard_df_top10))
    bottom = [0] * len(hazard_df_top10)

    for idx, collection in enumerate(collections):
        values = hazard_df_top10[collection].values
        bars = ax.bar(x_pos, values, bottom=bottom, label=collection,
                     color=colors[idx], edgecolor='black', linewidth=0.5, alpha=0.8)

        # Add value labels on bars if significant
        for i, (bar_pos, val) in enumerate(zip(x_pos, values)):
            if val > 0:
                ax.text(bar_pos, bottom[i] + val/2, str(int(val)),
                       ha='center', va='center', fontsize=8, fontweight='bold', color='white')

        # Update bottom for stacking
        bottom = [bottom[i] + val for i, val in enumerate(values)]

    # Add total count on top
    for i, total in enumerate(hazard_df_top10['Total Count']):
        ax.text(i, bottom[i], str(int(total)), ha='center', va='bottom', fontweight='bold', fontsize=9)

    ax.set_xticks(x_pos)
    ax.set_xticklabels(labels, rotation=45, ha='right', fontsize=9)
    ax.set_xlabel('Hazard Type', fontsize=12, fontweight='bold')
    ax.set_ylabel('Number of Events', fontsize=12, fontweight='bold')
    ax.set_title('Top 10 Hazard Events by Code and Collection Source', fontsize=13, fontweight='bold')
    ax.legend(loc='upper right', fontsize=10)
    ax.grid(axis='y', alpha=0.3)

    plt.tight_layout()
    plt.show()

    print(f"\n{'='*80}")
    print(f"Total Events: {hazard_df_top10['Total Count'].sum()}")
    print(f"Unique Hazard Codes Displayed: {len(hazard_df_top10)} (out of {len(hazard_df)} total)")
else:
    print("\nNo hazard codes found in collections")
Hazard Code Analysis
Analyzing hazard codes from multiple data sources...
Collections to analyze: gdacs-events, glide-events
gdacs-events: 100 items retrieved
glide-events: 100 items retrieved
================================================================================
HAZARD CODE COUNTS
================================================================================
Top 10 Hazard Code Counts:
Hazard Code Description Total Count GDACS EM-DAT GLIDE
GH0101 Earthquake (UNDRR-ISC) 96 93 0 3
EQ Earthquake 96 93 0 3
nat-geo-ear-gro Earthquake (EM-DAT) 96 93 0 3
GH0001 Unknown 24 0 0 24
GH0002 Unknown 24 0 0 24
GH0003 Unknown 24 0 0 24
GH0004 Unknown 24 0 0 24
GH0005 Unknown 24 0 0 24
nat-hyd-flo-flo Flooding (EM-DAT) 21 0 0 21
MH0030 Unknown 18 0 0 18
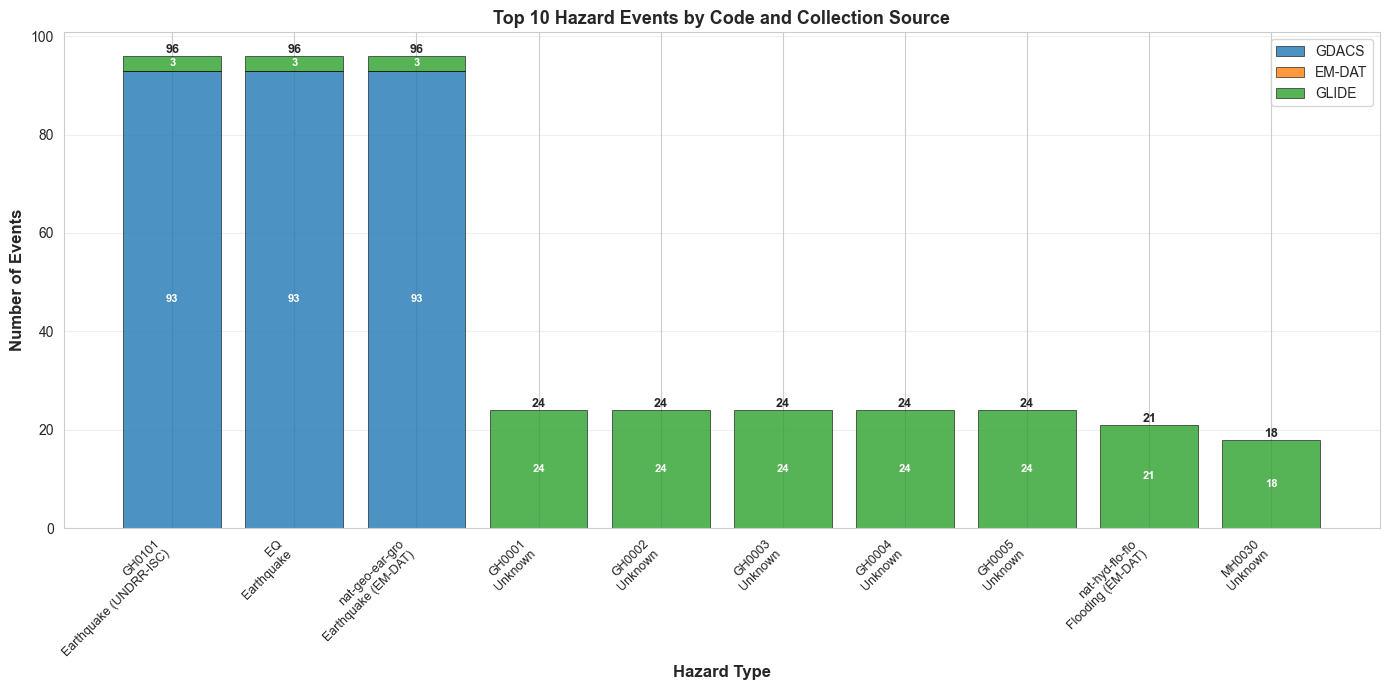
================================================================================
Total Events: 447
Unique Hazard Codes Displayed: 10 (out of 43 total)
8. Interactive Map Visualization
Create an interactive map showing disaster locations in Europe for the last 3 months across multiple collections (GDACS, EM-DAT, GLIDE).
# Install folium if not already installed

import folium
from folium import plugins
print("Folium already installed")
Folium already installed
# Define Europe bounding box and time range
europe_bbox = [-10.0, 35.0, 40.0, 71.0]  # [min_lon, min_lat, max_lon, max_lat]

# Calculate date range (last 120 days)
end_date = datetime.now()
start_date = end_date - timedelta(days=120)
datetime_range = f"{start_date.strftime('%Y-%m-%d')}T00:00:00Z/{end_date.strftime('%Y-%m-%d')}T23:59:59Z"

# Fetch data from all three collections
map_collections = ['gdacs-events', 'emdat-events', 'glide-events']
all_map_items = []

for collection in map_collections:
    try:
        items = search_stac(
            collections=[collection],
            bbox=europe_bbox,
            datetime_range=datetime_range,
            max_items=100
        )
        for item in items:
            item.properties['source_collection'] = collection
        all_map_items.extend(items)
    except Exception as e:
        pass

print(f"Total events found: {len(all_map_items)}")
Total events found: 71
# Analyze and extract hazard information from events
def extract_hazard_name(title):
    """Extract hazard name from title by taking text before ' in '"""
    if not title or title == 'No title':
        return 'Unknown'
    hazard_name = title.split(' in ')[0].strip()
    return hazard_name if hazard_name else 'Unknown'

# Build hazard code names mapping from event titles
hazard_code_names = {}
for item in all_map_items:
    hazard_codes = item.properties.get('monty:hazard_codes', [])
    if isinstance(hazard_codes, list):
        for code in hazard_codes:
            if code not in hazard_code_names:
                title = item.properties.get('title', 'No title')
                hazard_code_names[code] = extract_hazard_name(title)

print(f"Extracted {len(hazard_code_names)} unique hazard types from {len(all_map_items)} events")
Extracted 23 unique hazard types from 71 events
# Create interactive map with hazards
import matplotlib.cm as cm
import matplotlib.colors as mcolors

# Center map on Europe
europe_center = [50.0, 15.0]
m = folium.Map(
    location=europe_center,
    zoom_start=4,
    tiles='OpenStreetMap'
)

# Define colors for each source collection (outline colors)
source_colors = {
    'gdacs-events': '#1f77b4',      # Blue
    'emdat-events': '#ff7f0e',      # Orange
    'glide-events': '#2ca02c'       # Green
}

# Track which hazard names actually have valid coordinates
hazards_on_map = set()

# First pass: identify which hazard names have valid coordinates
for item in all_map_items:
    if item.geometry and item.geometry.get('coordinates'):
        coords = item.geometry['coordinates']
        if item.geometry['type'] == 'Point':
            lon, lat = coords[0], coords[1]
            hazard_codes = item.properties.get('monty:hazard_codes', [])

            if isinstance(hazard_codes, list) and len(hazard_codes) > 0:
                hazard_name = hazard_code_names.get(hazard_codes[0], 'Unknown')
                hazards_on_map.add(hazard_name)

# Generate distinct colors only for hazards that are on the map
unique_hazard_names = sorted(list(hazards_on_map))
num_hazards = len(unique_hazard_names)

if num_hazards > 0:
    cmap = cm.get_cmap('tab20', num_hazards)
    hazard_colors = {}
    for idx, hazard_name in enumerate(unique_hazard_names):
        rgba = cmap(idx)
        hex_color = mcolors.rgb2hex(rgba)
        hazard_colors[hazard_name] = hex_color
else:
    hazard_colors = {}

# Add markers for each event
for item in all_map_items:
    if item.geometry and item.geometry.get('coordinates'):
        coords = item.geometry['coordinates']

        if item.geometry['type'] == 'Point':
            lon, lat = coords[0], coords[1]

            # Get event details
            title = item.properties.get('title', 'No title')
            hazard_codes = item.properties.get('monty:hazard_codes', [])
            source = item.properties.get('source_collection', 'Unknown')

            # Extract hazard name from first code
            hazard_name = 'Unknown'
            if isinstance(hazard_codes, list) and len(hazard_codes) > 0:
                hazard_name = hazard_code_names.get(hazard_codes[0], 'Unknown')

            # Get colors
            fill_color = hazard_colors.get(hazard_name, 'gray')
            outline_color = source_colors.get(source, 'black')

            # Create popup
            codes_str = ', '.join(hazard_codes) if isinstance(hazard_codes, list) else str(hazard_codes)
            popup_text = f"<b>{title}</b><br>Hazard: {hazard_name}<br>Codes: {codes_str}<br>Source: {source}"

            # Add marker
            marker = folium.CircleMarker(
                location=[lat, lon],
                radius=8,
                popup=folium.Popup(popup_text, max_width=300),
                color=outline_color,
                fill=True,
                fillColor=fill_color,
                fillOpacity=0.7,
                weight=2
            )
            marker.add_to(m)

# Add legend for hazard names (fill colors) - only those on the map
hazard_legend_html = '<div style="position: fixed; bottom: 50px; right: 50px; width: 220px; background-color: white; border:2px solid grey; z-index:9999; font-size:12px; padding: 10px; border-radius: 5px;"><h4 style="margin-top:0;">Hazard Types</h4>'
for hazard_name in unique_hazard_names:
    color = hazard_colors.get(hazard_name, 'gray')
    hazard_legend_html += f'<p><i class="fa fa-circle" style="color:{color}"></i> {hazard_name}</p>'
hazard_legend_html += '</div>'

# Add legend for sources (outline colors)
source_legend_html = '<div style="position: fixed; bottom: 50px; left: 50px; width: 220px; background-color: white; border:2px solid grey; z-index:9999; font-size:12px; padding: 10px; border-radius: 5px;"><h4 style="margin-top:0;">Data Sources</h4>'
for source, color in source_colors.items():
    source_name = source.replace('-events', '').upper()
    source_legend_html += f'<p style="border-left: 4px solid {color}; padding-left: 8px;">{source_name}</p>'
source_legend_html += '</div>'

m.get_root().html.add_child(folium.Element(hazard_legend_html))
m.get_root().html.add_child(folium.Element(source_legend_html))

print(f"Map created with {len(all_map_items)} events")
print(f"Hazard types on map: {', '.join(unique_hazard_names)}")
print(f"Sources: {', '.join(source_colors.keys())}")

display(m)
Map created with 71 events
Hazard types on map: Drought, Earthquake, Flood, Forest fires
Sources: gdacs-events, emdat-events, glide-events
- European Commission Joint Research Centre. (2024). Global Disaster Alert and Coordination System (GDACS). https://www.gdacs.org
- Guha-Sapir, D. (2024). EM-DAT: The Emergency Events Database. Centre for Research on the Epidemiology of Disasters (CRED). https://www.emdat.be
- Asian Disaster Reduction Center. (2024). GLobal IDEntifier Number (GLIDE). https://glidenumber.net